

What is a system landscape, application landscape, or software architecture?
A system landscape or application landscape is a schematic view of the applications, and in some cases the infrastructure, that a company uses. By getting an overview of all applications, you also learn which systems pass information to each other. These systems exchange data automatically, for example via an API connection. Such an overview is essential for reliable processes, performance, security and the further development of existing systems, as well as for integrating new systems or implementing new business requirements. Besides giving you good insight into the functionality the landscape needs, mapping it also builds support and speeds up acceptance within the company. A holistic picture of the landscape prevents applications from being treated as separate islands. The so-called spaghetti architecture, in which systems are integrated piecemeal and without foresight, becomes a thing of the past.
Creating a diagram of a system landscape
Drawing a system landscape is a good starting point before a project kicks off. It creates clarity about the systems, how they work and, above all, whether they exchange information. With this foundation, we can identify where synergies can be leveraged, what is missing and what needs improvement.
There is no such thing as a standard system landscape; every drawing of an architecture or landscape is different. That's because every organization is unique and has its own architecture. A drawing of your landscape shows how all the applications and information systems used in your organization fit together. What information is exchanged? What links exist? Do the systems exchange data via an API connection?
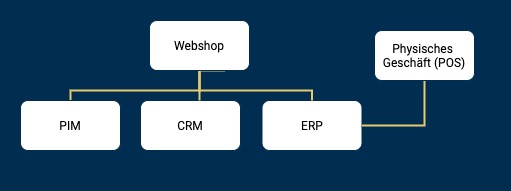
Figure 1 shows a landscape with individual links between the respective systems. It is a very simple representation of a landscape in which only one relationship between systems is drawn. Figure 2 highlights the relationship between the web shop and the ERP and additionally shows which data is transferred. The arrows also show where the information comes from and where it goes. For example, the ERP supplies the stock levels to the web shop, the web shop sends the orders to the ERP, and the ERP can then update the stock levels again. If you would like to learn more about how a web shop and internal systems work together, read the following blog post.
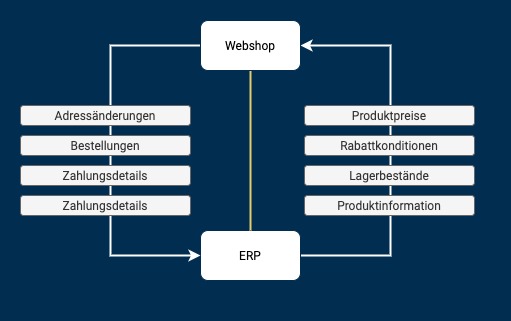
A diagram can use various elements to represent the dimensions of a relationship. In Figure 2, the general relationship between the web shop and the ERP is clearly shown by the yellow line. Which data is exchanged is indicated by the white arrows with the specific elements. You may have heard of the Unified Modeling Language, or UML diagrams. This modeling language can be used to visualize a system landscape. There are different types of UML diagrams, e.g. class diagrams, package diagrams or collaboration diagrams. That said, UML is not always the best choice for a general representation of a system landscape. What matters most is that the stakeholders understand the diagram. A picture is worth a thousand words, even if a system landscape isn't drawn according to UML.
Step 1. Assess the status quo and gather information
The first step is to take stock of all the systems used in your company. What's the best way to do this? Start with the IT department. They often already have a good overview of the various software systems. Based on this overview, you can then visit every department in the company to verify it. Take stock of which systems are used for what, and also which systems are outdated and no longer in use. Include systems that are irrelevant to you at the moment, too. In the future, these systems may need connections as well.
Step 2. Daily business: operations
You now know which systems exist, but you still need to find out how they work and whether they communicate with each other. If IT doesn't know which APIs are connected to each other, take your overview to the various departments and ask which data is transferred. Does the same data have to be maintained in several systems? Or when something is entered in system A, does it also show up in system B? The next step is then to find out exactly how the data is transferred.
Step 3. Drawing: let's get started
You now know which systems exist and which of them (partly) communicate with each other. Gathering all the information probably took some time, but it makes drawing the application landscape much easier. As mentioned before, every landscape is different. However, drawing a landscape becomes easier if:
- all systems in the landscape are listed
- it is made clear which systems communicate with each other (using arrows)
- it is made clear how the data exchange takes place, i.e. via API or another type of data exchange
- detailed and complex processes are drawn in a separate diagram, e.g. exactly which information is exchanged
There are various tools you can use to draw the landscape. If you use G Suite, you can use Google Drawings. Draw.io is also a good tool and can be used in Google Drive via the G Suite Marketplace. More complex, paid tools include Bizagi or Signavio.
Mapping new business requirements in the system landscape
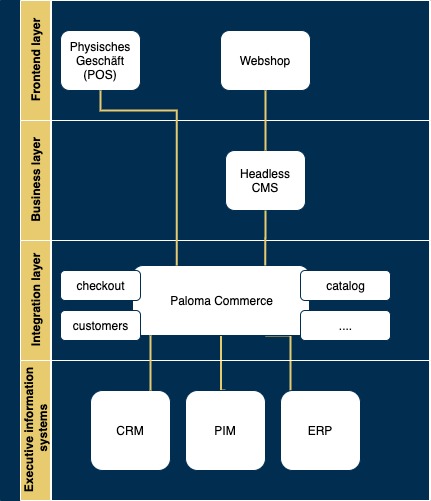
Now that you have mapped your current system landscape, you can specify the business requirements that need to be implemented in much more detail and add them to the landscape. Perhaps a new system is being introduced and needs to be integrated accordingly, or changes to existing systems have to be implemented. In your conversations with IT, marketing and the other departments, you have probably already gotten an idea of which changes are needed.
It may well be, however, that you started gathering information but got stuck. Or you have mapped the current system landscape but don't know how to integrate the new requirements. We'll be happy to help you find out which systems are connected to each other and how new requirements could be implemented.
Header image: Photo by Annie Spratt on Unsplash